Minimal SI model in NetLogo
NetLogo is a free environment for Agent Based Modelling. It was used to implement the Minimal SI model:
Download the source code. Run on the web. An excerpt from the online help follows.
WHAT IS IT?
Do you know how an epidemic grows? One infects two, two infect four or three or two or one or none. All with different probabilities and a weighted average of logistic growth.
The Minimal SI model is a discrete stochastic compartmental model of an epidemic that averages to the (ordinary differential equation) SI model. Each individual within a population is in one of two states known, in epidemic modelling, as compartments:
- S - Susceptible to infection.
- I - Infected and infectious.
HOW IT WORKS
Setup
There are sliders to vary:
- The size of the population that will be divided into compartments.
- The basic reproduction number.
The basic reproduction number, R0, is defined as the number of individuals that will be infected by one individual in an otherwise susceptible population.
Go
Initially one individual is infected. At each step the simulation proceeds by each infected individual selecting R0 others at random and irrespective of their state - the model is said to be "well mixed". At the end of the step those susceptible that were selected become infected. The simulation finishes when there are no longer any susceptible. (Note there is a subtle bug which occasionally appears to thwart this being strictly true)
As the simulation progresses lines are drawn between the previous generation of infected and those individuals that they were in contact with. The colour of the individuals changes according to the code:
- Susceptible - Blue.
- Infected - Red.
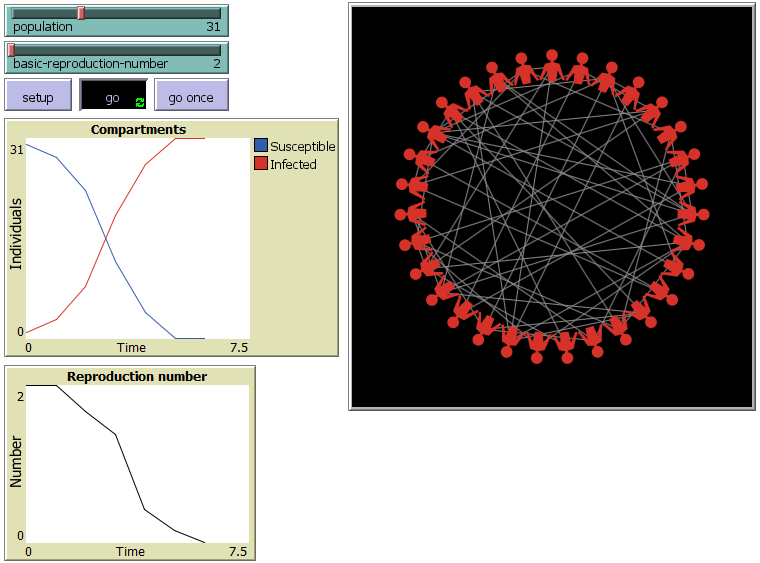
There are two plots of how the statistics vary as the iterations proceed. The first shows how the individuals are divided between the two compartments. The second how the reproduction number varies between zero and R0.
HOW TO USE IT
Move the sliders then press setup. Perform a simulation and note how the epidemic curves vary.
THINGS TO NOTICE
Sigmoid curves
When plotted against time the number of susceptible always decrease. i.e. the curve is monotonic decreasing. Similarly, the number of infected is monotonic increasing and a mirror of the other curve. For the SI model these are both sigmoid (S-shaped) curves. For a given simulation the plots of the minimal SI model may be more or less sigmoid.
Variation of the reproduction number
If this were constant then the epidemic would be growing exponentially. The initial step plots a value of R0 which matches its definition.
If this were the SI model instead then it would be the smoothly decreasing function R0 x S / N where S is the number of susceptible and N = S + I is the size of the population.
Selecting R0 others
Each infected picking the number of susceptible is equivalent to sampling (without replacement) R0 individuals from a hypergeometric probability distribution.
Exponential growth
Requires that only susceptible are picked. The probability of that happening can then be calculated by forming a fraction where the numerator is the numbers from the size of the population down to one all multiplied together and the denominator is the number of choices multiplied together. e.g. 31 x 30 x 29 x 28 x ... x 1 divided by 31 x 30 x 29 x 30 ... x 29 for a population of 31, no prior immunity and R0 equal to 2.
Evaluating the fraction results in roughly a two in a million million chance. Truncating it to correspond to the first 8 individuals results in roughly an even chance.
Actual examples of exponential growth appear to be all man-made:
- Compound interest, which dates back to the Babylonians at least
- Grains of wheat on a chessboard, according to folklore from ancient India and Persia
- Pyramid schemes