Mathematical modelling is merely abstraction
Epidemics
An epidemic is like a game of tag.
Epidemiological tag
When tagged, tag two others. If tagged again ignore.
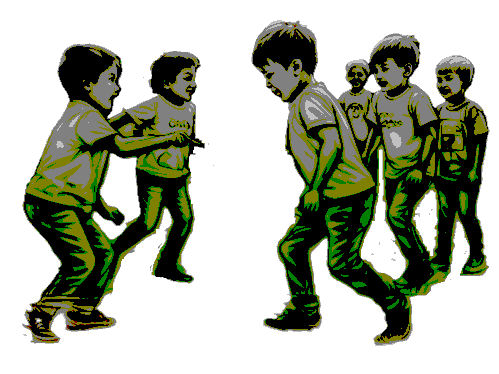
At the end of the game there may be some children who were never tagged. This is due to an emergent behaviour known as herd immunity.
A game of tag is like a game of cards.
Epidemic, the card game
Replace each child with two copies of the same card. One card is shuffled with the rest of its pack minus one that is tagged then two cards are dealt to determine who tags who. The other pack tracks the state with the columns of the generations forming a histogram of the infections.
The probability of the columns containing 1, 2, 4, 8 then 16 cards can be calculated in a manner similar to the birthday problem. i.e. The probability of matching exponential growth decreases as

Note that the first three cards are certainties. The basic reproduction number, R0, is defined as the number of people an infected person would infect in an otherwise susceptible population. Hence here it equals 2. The reproduction number is defined by the ratio of the column heights so, for the game above, it goes 2, 2, 3/2, 1, 1/3, 3/2 and, finally, 0.
A game of cards is like a computer simulation.
The minimal SIR model online
Press 'setup' to start a game. Press 'go once' to see who tags who. The currently infected are coloured red.
Press 'go', then repeatedly press 'setup' to generate the average curves which are coloured grey.
Note that the bottom right plot exists to show that this model averages, at scale, to the standard SIR model of Kermack-McKendrick (1927) apart from at the very beginning and very end where the standard model is wrong. That model is extensively validated against real world data. Hence this model has been validated unlike some other epidemic models which are validated against only one dataset or that have so many parameters that they fit the noise rather than the signal and thus have no predictive ability. The literature indicates that there are even some models that are only investigated for their Mathematical properties and are never validated against the real world.
Special mention should be given to the chain binomial models which start with the model of Reed-Frost (1928). Like the minimal SIR model it deals randomly with whole individuals - unlike the standard SIR model which is an ordinary differential equation model. It's authors noted that it was a toy model - one that produced behaviour that looks realistic but the numbers are wrong. In particular the average growth rate is not logistic even though it shares the same parsimonious assumption that everyone is treated equally with the minimal and standard SIR models. Despite this there have been numerous models extending the work including those that have been used to misadvise governments, either directly or through their research funding bodies.
Conclusion
Three different implementations of the same model are presented above with increasing complexity leading to increasing understanding. Any claims that modelling is hard can be countered by the example of child's play.
Hopefully the reader takes away the lesson that they should not accept a model just because of the credentials of the modeller. This should be evident from the people who, following Malthus, said epidemics grow exponentially, presumably because they don't understand that exponential growth is seen more times than it exists. Darwin said that, for the case of man, in a few generations there would not be any standing room left. Reductio ad absurdum. All models should be interrogated for their flaws.
Do you know how an epidemic grows? One infects two. Two infect four or three or two or one or none. All with different probabilities and a weighted average of logistic growth.